applications in resource management
Josh Erickson
USDA-Forest Service
About Me
- Hydrologist (day job); Kootenai National Forest
About Me
Hydrologist (day job); Kootenai National Forest
Focus is leveraging computing platforms (R, Python, GEE) for resource management work.
About Me
Hydrologist (day job); Kootenai National Forest
Focus is leveraging computing platforms (R, Python, GEE) for resource management work.
In my free time I like work on open source packages in R; {tidyrgee}, {gwavr}, {whitewater}
Shout out
Shout out
Joe Fortier - Northern Region Geospatial Group
Shout out
Joe Fortier - Northern Region Geospatial Group
Sam Lammie - NRGG Program Manager
Shout out
Joe Fortier - Northern Region Geospatial Group
Sam Lammie - NRGG Program Manager
weblidar-treetop - A lot of inspiration was built off of this!
Outline
Outline
- Quick overview of the app.
Outline
- Quick overview of the app.
- Go through a demo of the app.
Outline
- Quick overview of the app.
Go through a demo of the app.
Possible use case (toy example).
What is trexr?
What is trexr?
- {trexr} stands for Tree Exploration in R
What is trexr?
{trexr} stands for Tree Exploration in R
A free open source software (FOSS) application (
 ); essentially a tool...
What is trexr?
{trexr} stands for Tree Exploration in R
A free open source software (FOSS) application (
 ); essentially a tool...
Provides users the ability to look at canopy height models (CHM) in a few different ways.
What is trexr?
{trexr} stands for Tree Exploration in R
A free open source software (FOSS) application (
 ); essentially a tool...
Provides users the ability to look at canopy height models (CHM) in a few different ways.
- Descriptive Stats
What is trexr?
{trexr} stands for Tree Exploration in R
A free open source software (FOSS) application (
 ); essentially a tool...
Provides users the ability to look at canopy height models (CHM) in a few different ways.
Descriptive Stats
Graphs
What is trexr?
{trexr} stands for Tree Exploration in R
A free open source software (FOSS) application (
 ); essentially a tool...
Provides users the ability to look at canopy height models (CHM) in a few different ways.
Descriptive Stats
Graphs
Interactive Maps
What is trexr?
{trexr} stands for Tree Exploration in R
A free open source software (FOSS) application (
 ); essentially a tool...
Provides users the ability to look at canopy height models (CHM) in a few different ways.
Descriptive Stats
Graphs
Interactive Maps
3-d Visualization
What is trexr?
{trexr} stands for Tree Exploration in R
A free open source software (FOSS) application (
 ); essentially a tool...
Provides users the ability to look at canopy height models (CHM) in a few different ways.
Descriptive Stats
Graphs
Interactive Maps
3-d Visualization
- Hopefully a tool for natural resource practitioners to use!
Advantages
Advantages
- Great for winter time eda or time sensitive analysis
Advantages
Great for winter time eda or time sensitive analysis
Crop images, different mapping layers, stats, etc.
Advantages
Great for winter time eda or time sensitive analysis
Crop images, different mapping layers, stats, etc.
Works well next to a GIS platform
Advantages
Great for winter time eda or time sensitive analysis
Crop images, different mapping layers, stats, etc.
Works well next to a GIS platform
Really helps with planning and visualizing outliers.
Advantages
Great for winter time eda or time sensitive analysis
Crop images, different mapping layers, stats, etc.
Works well next to a GIS platform
Really helps with planning and visualizing outliers.
Disadvantages (IMO)
Advantages
Great for winter time eda or time sensitive analysis
Crop images, different mapping layers, stats, etc.
Works well next to a GIS platform
Really helps with planning and visualizing outliers.
Disadvantages (IMO)
- Language specific (R)
Advantages
Great for winter time eda or time sensitive analysis
Crop images, different mapping layers, stats, etc.
Works well next to a GIS platform
Really helps with planning and visualizing outliers.
Disadvantages (IMO)
Language specific (R)
Not programmed asynchronously
Advantages
Great for winter time eda or time sensitive analysis
Crop images, different mapping layers, stats, etc.
Works well next to a GIS platform
Really helps with planning and visualizing outliers.
Disadvantages (IMO)
Language specific (R)
Not programmed asynchronously
Not a GIS
Resource Applications
- Explore some potential units for planning/recon, etc
Resource Applications
Explore some potential units for planning/recon, etc
Good for winter time, safety reasons or quick eda
Flow
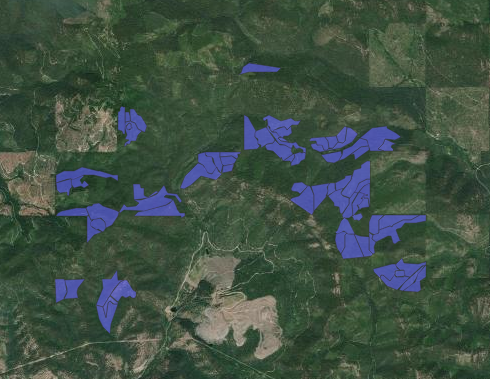
- Bring in units
Flow
- Bring in units

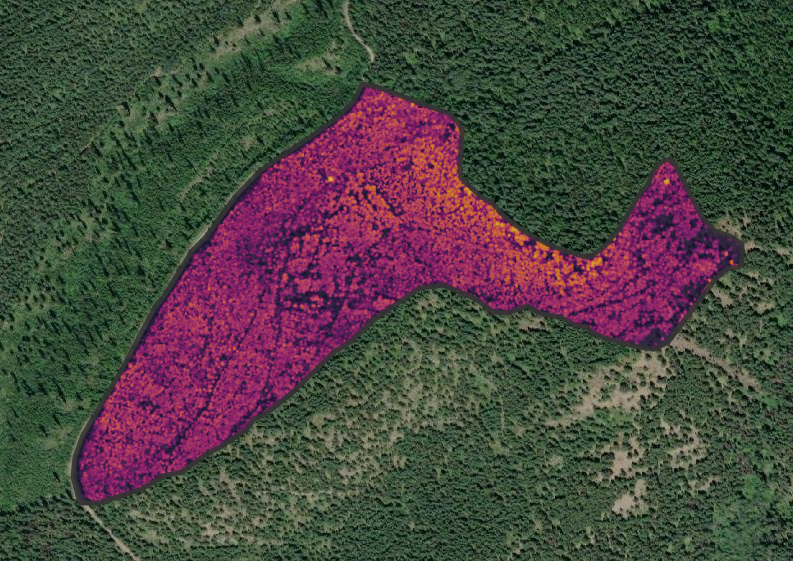
- Extract CHM, stats, etc.
Flow
- Bring in units

- Extract CHM, stats, etc.

- Visualise
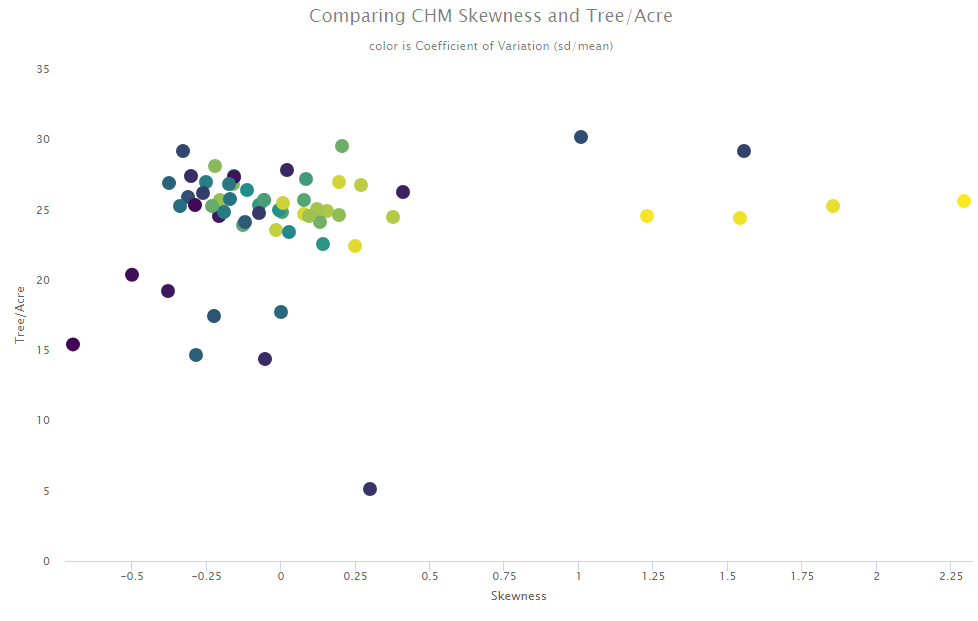
Stats
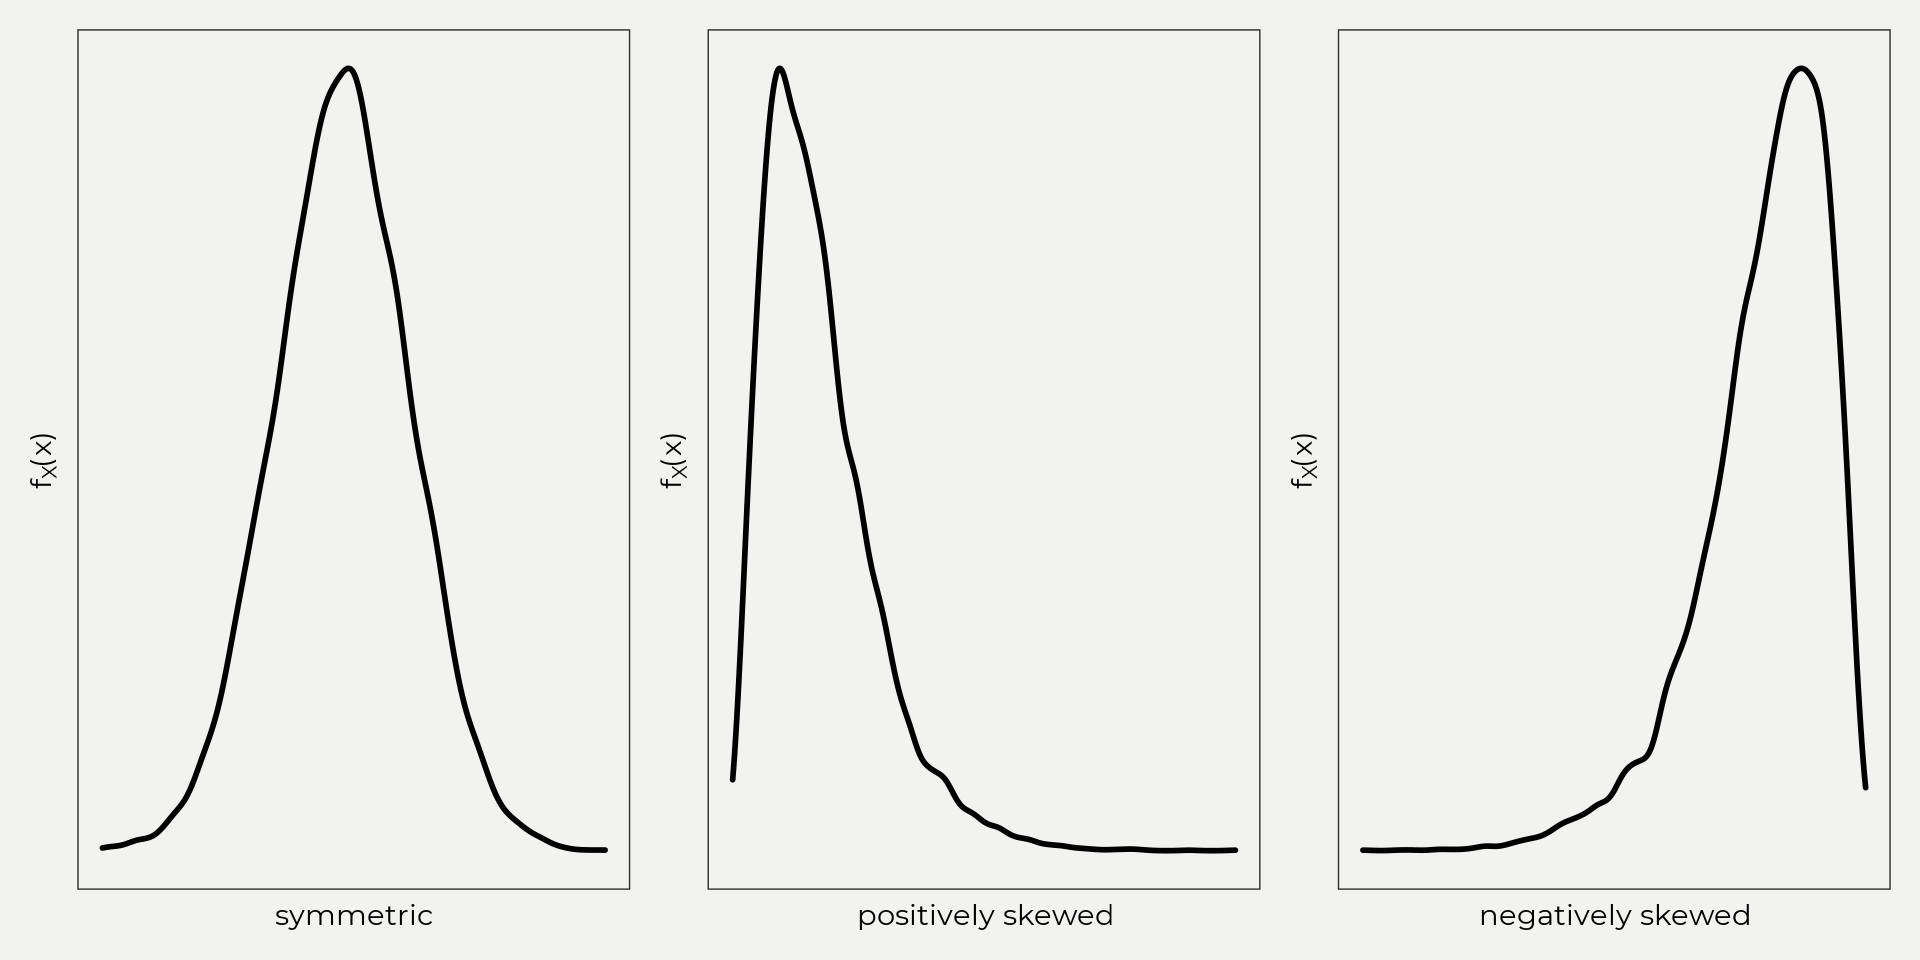
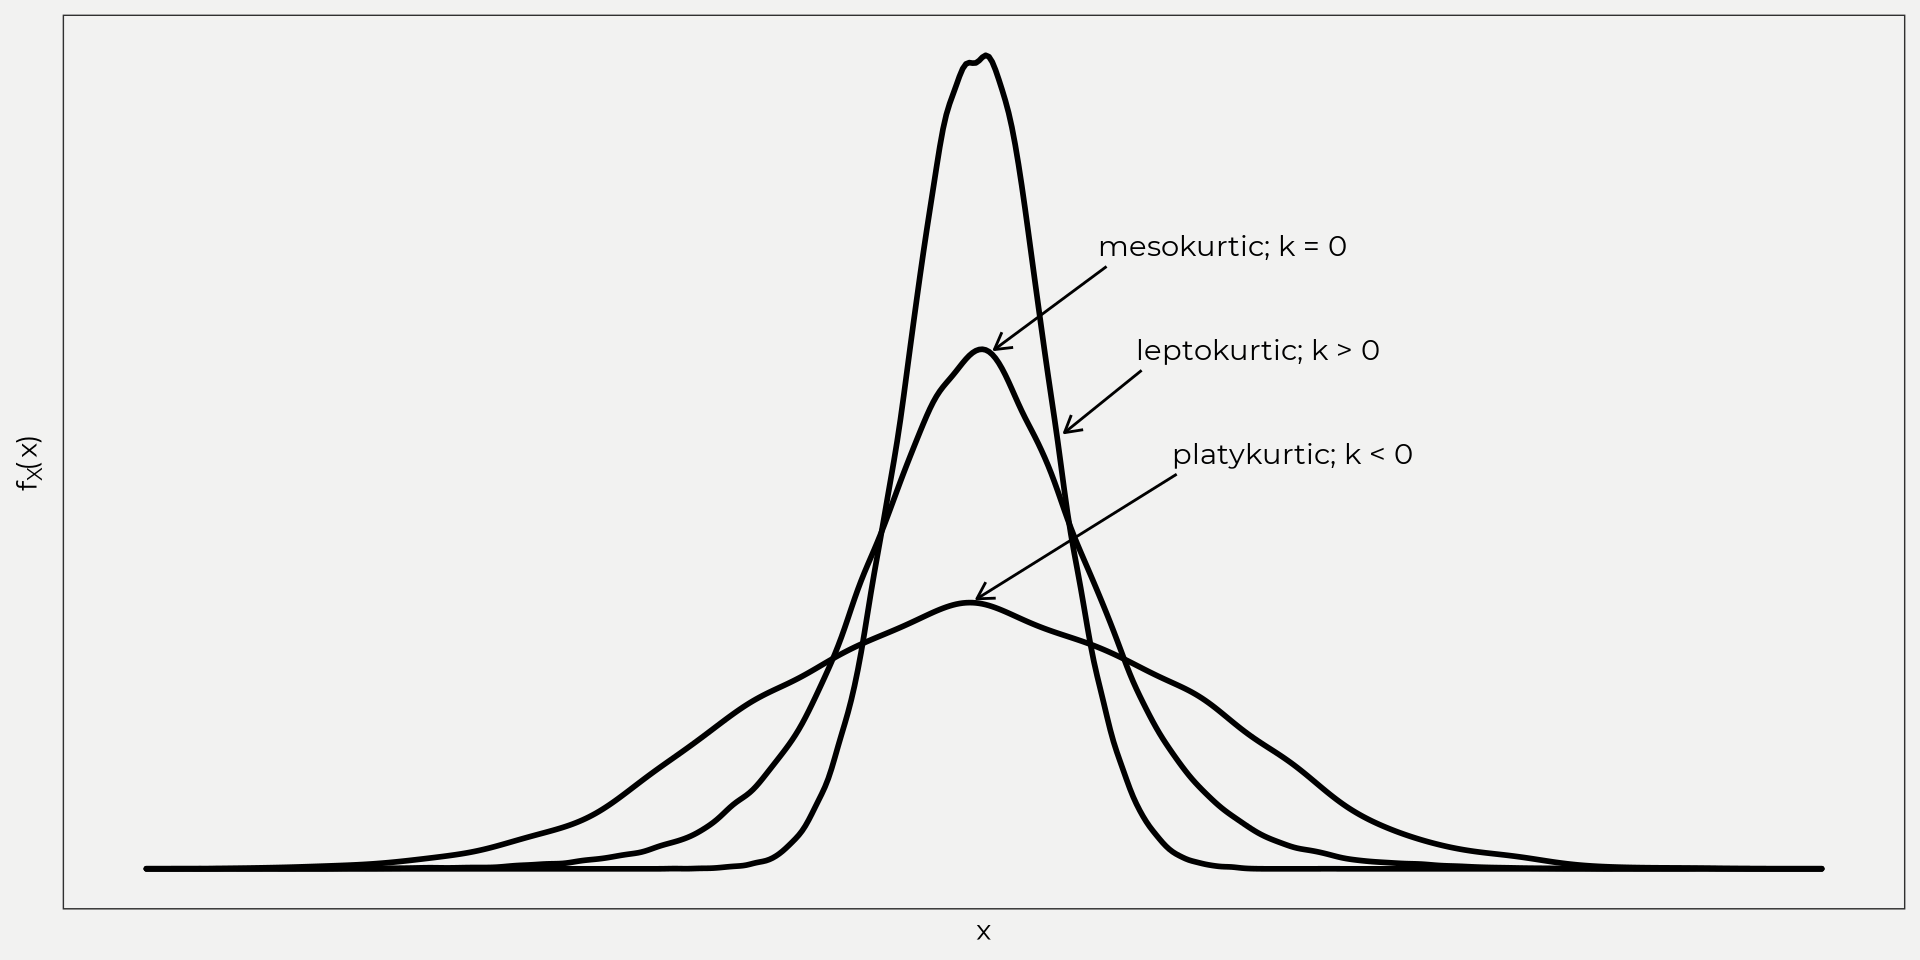
- Some things that I've found useful are skewness, kurtosis and coefficient of variation (cv).
Stats
- Some things that I've found useful are skewness, kurtosis and coefficient of variation (cv).
Stats
- Some things that I've found useful are skewness, kurtosis and coefficient of variation (cv).

How to get trexr
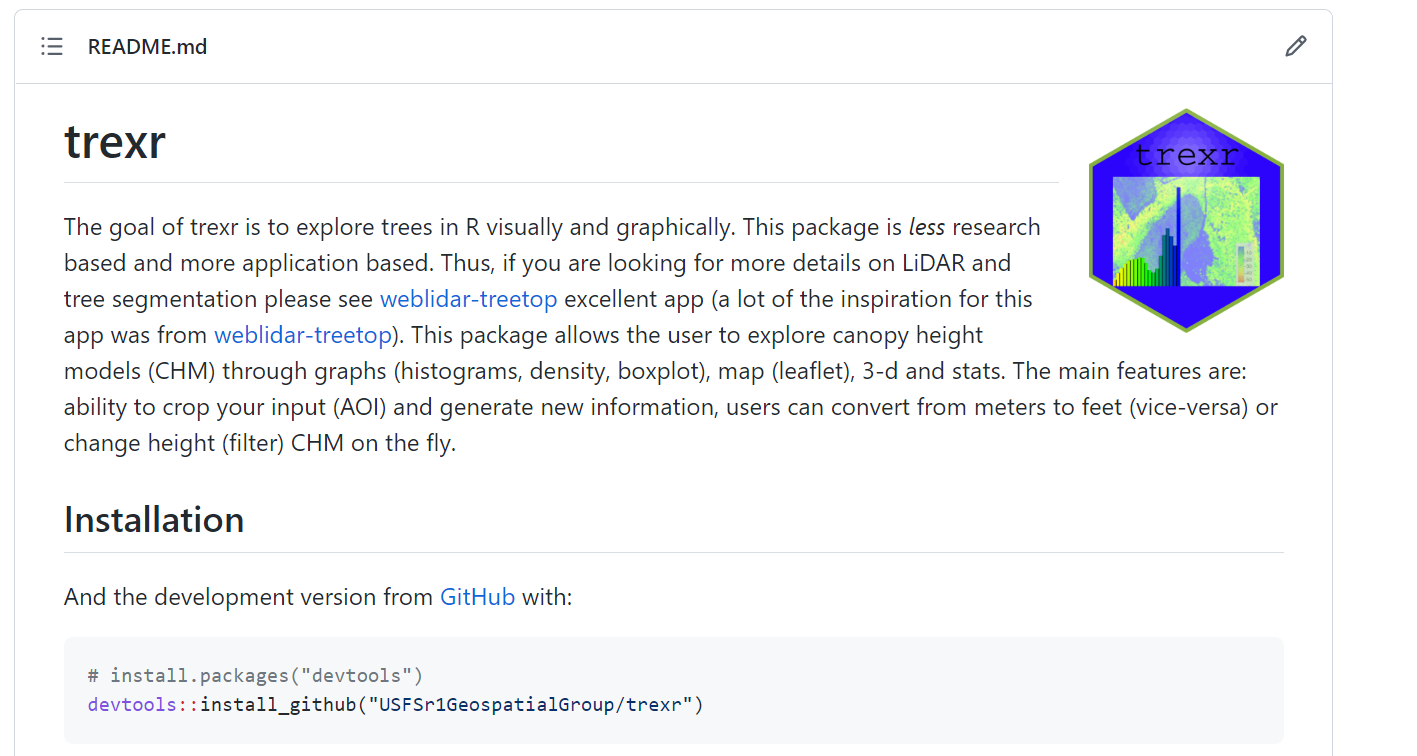
- You can download the development version from github via https://github.com/USFSr1GeospatialGroup/trexr
How to get trexr
- You can download the development version from github via https://github.com/USFSr1GeospatialGroup/trexr
- Or you can use with citrix! Follow these awesome tutorials by Joe Fortier to get you going!
How to get trexr
- You can download the development version from github via https://github.com/USFSr1GeospatialGroup/trexr

Or you can use with citrix! Follow these awesome tutorials by Joe Fortier to get you going!
Documentation from NRGG coming soon.
The End

